| BTC/PAB | Sell | Buy | % |
|---|
| 1 BTC to PAB |
95048.07 |
95238.55 |
0% |
| 1 Bitcoin to Panamanian Balboa Charts |
|---|
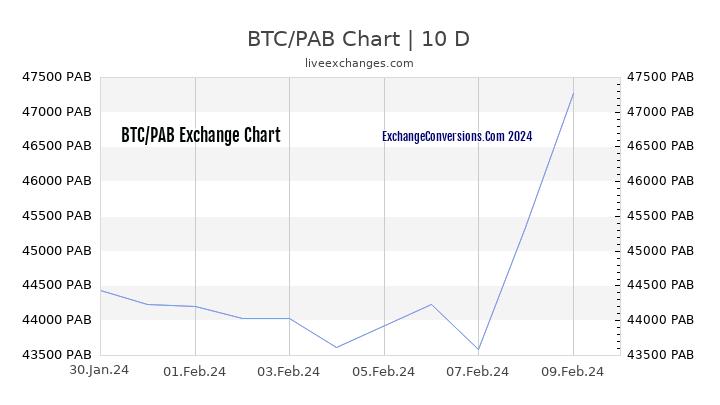
BTC to PAB Chart Today
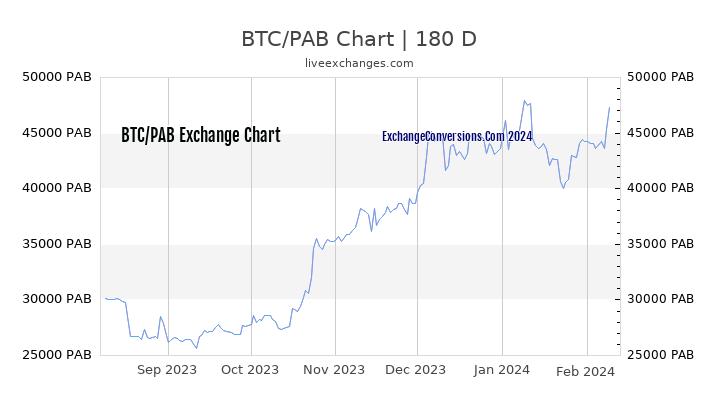
BTC to PAB Chart 6 Months
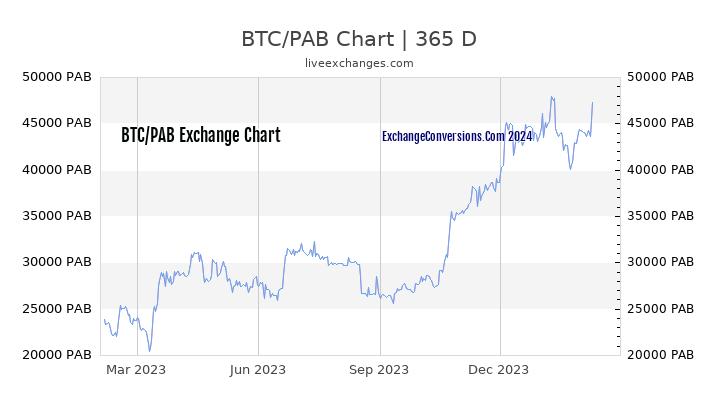
BTC to PAB Chart 1 Year
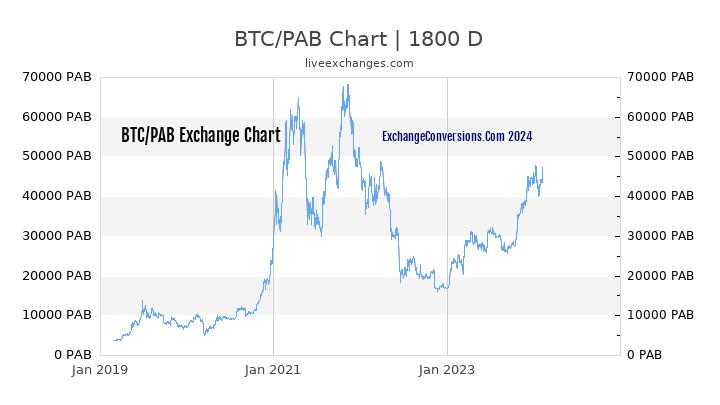
BTC to PAB Chart 5 Years
This page shows
charts for Bitcoin/Panamanian Balboa currency exchange pair, includes, today's chart as intraday, last 6 month, and also for long term charts as 1 year and 5 years. At chart page of the currency pair, there are
historical charts for the BTC/PAB, available for up to 5-years.
When you want to
buy Bitcoin and sell Panamanian Balboa, you have to look at the
BTC/PAB currency pair to learn rates of buy and sell. Exchangeconversions.com provides the most recent values of the exchange rates. Currency rates are updated each second when one or two of the currency are major ones. It is free and available for everone to track live-exchange rate values at exchangeconversions.com. The other currency pair results are updated per minute.
Exchange pair calculator for BTC/PAB are also available, that calculates both bid and ask rates for the mid-market values. Buy/Sell rates might have difference with your trade platform according to offered spread in your account.
